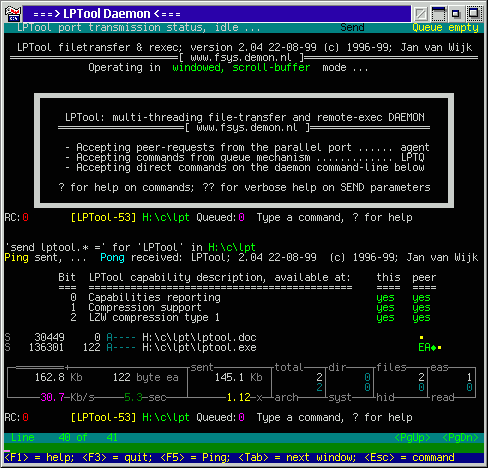
LPTool daemon screenshot and introduction
Click on any part of the daemon screen to get an explanation ...

This is the title-bar of the OS/2 window, here with a title a created
by the lptd command.
It includes the operatingsystem level controls for the window like
the system-menu, maximize, minimize and close and the rollup-button
created by the Object-Desktop add-on product.
[Back] [Top]
The status line at the top display information on the file currently
sent or received, and the involved queue-buffers.
The line either shows the idle status with related send/receive
queue empty, or when active:
- A function indicator:
- S for send
- R for receive
- F for find
- File information with:
- The size of the file in bytes
- The size of extended attributes (EA's)
- The full filename, including path.
- The number of 32Kb blocks currently in the related in-memory queue
These queues are located between:
- The disk-reading and the port-send thread when sending
- The port-reading (agent) and the disk-write thread when receiving
[Back] [Top]
This is the standard LPTool logo shown at startup with:
- Short description
- Version and date information
- The copyright statement
- A reference to the LPTool homepage on the WEB
- A line indicating the current display mode:
- Classic mode, using a simple command-line and scrolling output
- Windowed mode, using a large scroll-buffer and an antryfield with
command-recall for input
[Back] [Top]
An additional logo-text that explains the functionality of the daemon in short,
it is shown once at startup, and repeated after each prompt when the
prompting leel is set at a high level.
[Back] [Top]
The LPTool prompt line contains the following information:
- The return-code of the last command executed
- An identification of this LPTool daemon, a name plus number
The appended number is the process-id (PID) of the daemon.
- The current directory for the daemon, this will be set to the
same current-directory as the client for the current/last command
and is used for any relative-path filespecfications.
- The number of commands still pending (Queued)
- The actual prompt text: 'Type a command ...'
[Back] [Top]
This is a display of the command to be executed next, with:
- The command-string to be executed, in single quotes
- An identification of the responsible client, this can be the user-interface part
of LPTool tself (entryfield) or an instance of LPTQ or other third-party
LPTool client.
The appended number usualy represents the process-id (PID) of the client.
- The current directory for the client, this will be the base to be
used for any relative-path filespecfications.
[Back] [Top]
A single line of output showing that a Ping has been sent, and
when properly connected, that a Pong has been received.
The pong text also identifies the LPTool version running at
the other end. When the versions are not equal, an addition LPTool
message will given as a warning that it might no be fully compatible.
[Back] [Top]
When using the 'ping +' command, the exchanged capabilities will be
reported for:
- this the LPTool running at this side
- peer the LPTool running at the other side of the cable
currently they are:
- Capabilities reporting, required for 'ping +'
- Generic compression support
- Specific compression algorithm support: LZW
Other capabilities might be added in future versions, the two LPTool at each end
will query the other side for matching capabilities.
[Back] [Top]
For each file sent or received, a single line will be displayed with:
- A function indicator:
- S for send
- R for receive
- F for find
- File information with:
- The size of the file in bytes
- The size of extended attributes (EA's)
- The full filename, including path.
- Progress information (send/receive) for the filetransfer, either:
- Dots and diamonds, a pseudo-graphic display where each complete diamond
represents about 128 Kb of transferred data
- Numeric value of the number of Kb/Mb transferred in 32Kb increments,
prefixed with a single dot/diamond that indicates current activity.
Both can be prefixed with an EA marker if the file has EA's
Compression is indicated by the dot/diamond color, yellow is compressed,
green is without compression.
[Back] [Top]
This is a summary display for all the files sent or received in the
previous batch. Normally it will be presented automaticcaly after each
send or receive session, it can be shown manually using the statcommand.
The fields in the first row are totals for:
- filesize, uncomressed
- size of involved EA's
- size actually sent in compressed form
- number of files/directories sent
- number of directories
- number of files
- number of files with EA's
The fields in the second row are:
- transfer speed
- elapsed time
- average compression ratio
- number of files with archive attribute set
- number of files with system attribute set
- number of files with hidden attribute set
- number of files with read-only attribute set
[Back] [Top]
The total LPTool window has 4 major parts:
- The scroll buffer, the largest part at the top
- A scroll-buffer status line, with:
- Current line (or #lines when at end)
- Number of lines, or percentage of buffer used
- Area for additional status information (yellow)
- Navigation info on PgUp/PgDown keys
- The command-line entryfield with a history-buffer for command recall
- A fixed helpline with usage information on key-bindings
The focus is normally on the entryfield, but can be transferred to the
scrollwindow using the tab-key.
[Back] [Top]
Return to:
-- LPTool page --
Fsys, DFSee and JvW home page
Created:
JvW 21-aug-1999, last update: JvW 12-dec-1999

